
The chart window
The toolbar, timeframes, the legend, the bottom bar and the drawing rail — where everything on a chart lives.
Every chart window has the same four parts: a toolbar across the top, the legend in the top-left of the price pane, the drawing rail down the left edge, and a bottom bar.
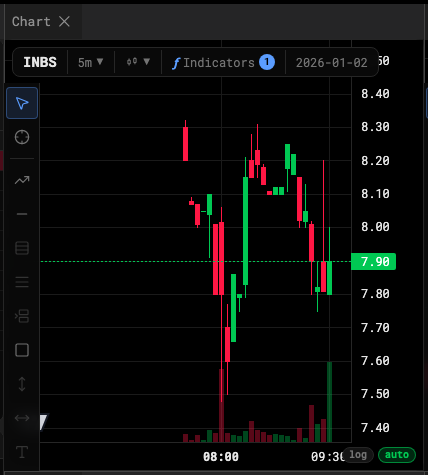
- Symbol
- Starred timeframes
- Every timeframe
- Chart type
- Indicators
- Save template
- Templates menu
- Chart settings
- Fullscreen
- Snapshot
The toolbar
| Control | What it does |
|---|---|
| Symbol | The name you’re replaying. It’s a label — the session sets it. |
| Timeframe chips | Your starred timeframes. Defaults: 10s, 1m, 5m, 15m, D. |
| ⌄ Chart interval | Every timeframe, grouped by seconds, minutes, hours and days. Star a row to make it a chip. |
| Chart type | Candles, Hollow candles or Heikin Ashi. |
| Indicators | Opens the catalog; the count shows how many are on. See Add indicators. |
| Template name | Saves this chart as a named template; the arrow beside it opens Save as, recent templates and Load. See Chart templates. |
| ⚙ Settings | The chart settings dialog. See Chart settings. |
| Fullscreen | Fills the screen with this chart. Press it again to come back. |
| Take a snapshot | Downloads the chart as a PNG, legend and order lines included. |
Timeframes
| Desk | Timeframes |
|---|---|
| Stocks, futures | 10s, 15s, 1m, 2m, 3m, 5m, 15m, 30m, 1h, 4h, 1D |
| Forex, gold and silver | 10s, 1m, 2m, 3m, 5m, 15m, 30m, 1h, 4h, 1D |
A starred timeframe only shows as a chip on desks that offer it. Switching never drops the session.
Price basis on forex
Forex charts — gold and silver included — add Bid · Mid · Ask to the toolbar: which side of the quote the candles are built from. It starts on Mid. The desk still never fills you at the mid.
The legend
The top-left of the price pane names the symbol and timeframe and reads out the bar under your crosshair — open, high, low, close and change — plus a row for every indicator. See Read the legend.
The bottom bar
Range chips, the chart’s clock and time zone, and the %, log and auto buttons. auto keeps the latest candle in view as the tape plays; scroll or drag and it lets go, click it to re-engage. See Ranges, scales and time zone.

- Range
- Chart clock and time zone
- Percent scale
- Log scale
- Follow the latest bar
Execution markers
Your fills are drawn on the chart where they happened. Hide them, or change their size, from the chart’s right-click menu or the Trading tab of chart settings.
More than one chart
Open another Chart from the Window Catalog. Each chart keeps its own timeframe, chart type, settings and indicators. With crosshairs synced, every window’s legend reads its own bar at the shared time.
Was this article helpful?
Related articles
- Chart settingsCandle colors, the legend, price lines and the countdown, the canvas, and chart trading — the five tabs of the settings dialog.
- Ranges, scales and time zoneThe chart's bottom bar — jump to a range, switch to percent or log, follow the tape, and pick the time zone.
- Read the legendThe values under your crosshair, one row per indicator, and the buttons that hide, edit and remove each one.