
Updated
Drawing tools
84 tools in six groups on the rail — how to find one, place it, and where to go next.
The rail down the left edge of every chart holds the tools.

- Cursor
- Lines and channels
- Gann and Fibonacci
- Patterns
- Positions and measurers
- Shapes
- Text and notes
- Magnet
- Lock
- Hide
- Remove
- Favorites strip
The rail
| Button | What’s in it |
|---|---|
| Cross | Disarms whatever tool is armed. |
| Trend tools | Trendline, rays, info line, horizontal and vertical lines, crossline; channels; pitchforks. |
| Gann and Fibonacci | Fib retracement, extensions, channels, time zones, fans, arcs, circles, spiral, wedge; Gann box, squares and fan. |
| Patterns | XABCD, Cypher, ABCD, Triangle, Three drives, Head and shoulders; five Elliott waves; cyclic lines, time cycles, sine line. |
| Forecasting and measurement | Long and short position, position forecast, bars pattern, ghost feed, sector; anchored VWAP, fixed-range and anchored volume profile; price, date, and date-and-price range. |
| Geometric shapes | Brush, highlighter, arrows, rectangle, circle, ellipse, path, polyline, triangle, arc, curves. |
| Annotation | Text, note, price note, pin, table, callout, comment, price label, signpost, flag mark. |
| Magnet | Snaps anchors to bar open, high, low or close. |
| Lock · Hide · Remove | Apply to every drawing on the chart. See Move, lock and remove drawings. |
| ★ | Shows the favorites strip. |
Each group button shows the last tool you used from it — click it to draw that again. The small arrow beside it opens the whole group.
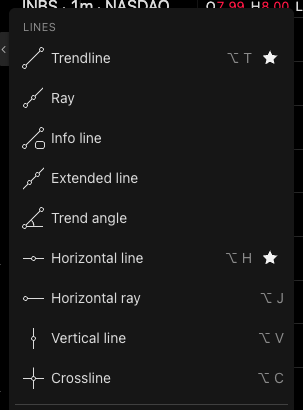
- Click to arm the tool
- Its hotkey
- Starred: kept on the favorites strip
Place a drawing
- Press, drag, release for two-point tools, or click each point in turn — both work.
- The space to the right of the last bar takes drawings, so you can project a level into time that hasn’t printed yet.
- The tool disarms once the drawing is placed. Esc cancels a tool mid-draw.
- Came out wrong? Click it and press Delete.
Next
Was this article helpful?
Related articles
- Move, lock and remove drawingsSelect a drawing to restyle it, drag it by its body, lock it against edits, and clear the chart safely.
- Drawing hotkeys, magnet and favoritesArm the common tools from the keyboard, snap anchors to the bars, and keep the tools you use on a strip.
- Long and short positionsPlan a trade on the chart — entry, stop and target with P&L, size and risk:reward worked out from the real bars.